So many major changes have been made across Google’s analytics ecosystem, your team might feel a bit lost looking around Google Analytics 4 (GA4). And that’s before they start to analyze the data.
Expect that disorientation to produce a litany of questions, like, “Where are our reports?” “What do these new metrics mean?” and “How will all this change how we monitor our metrics?”
Use this guide to help them get the answers.
Where are our reports?
Google organized all GA4 data under three main categories: Reports, Explore, and Advertising.
The reports menu
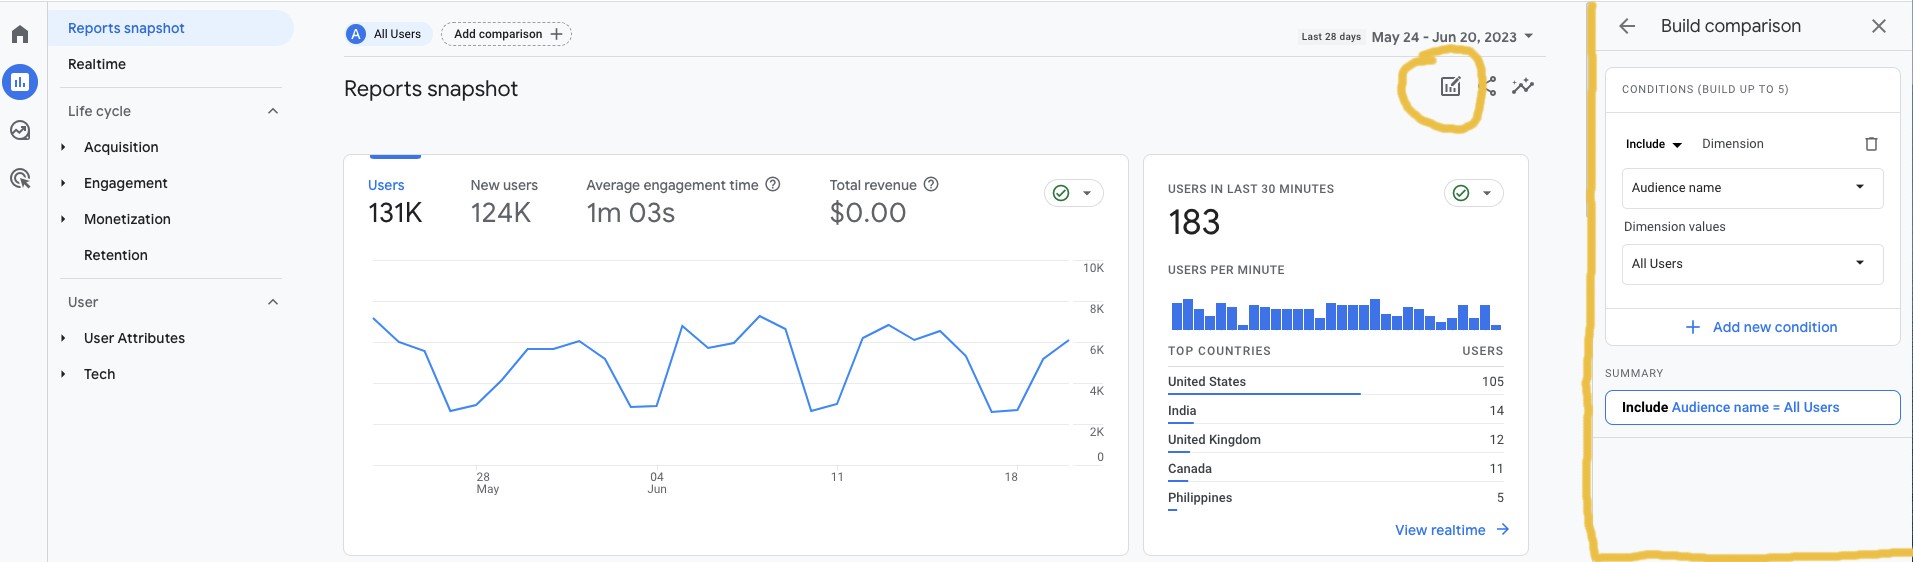
Clicking on Reports will bring you to a Reports snapshot view, where you’ll see a default collection of comparative insights. They’re organized into modules (Google calls them “cards”) of data related to performance questions you might have.
For example, in the image below, you can see cards labeled “How are active users trending,” “How well do you retain users,” and “Which pages and screens get the most views?” Inside those cards, you’ll see snapshots of top-line data that can help you determine the answers.
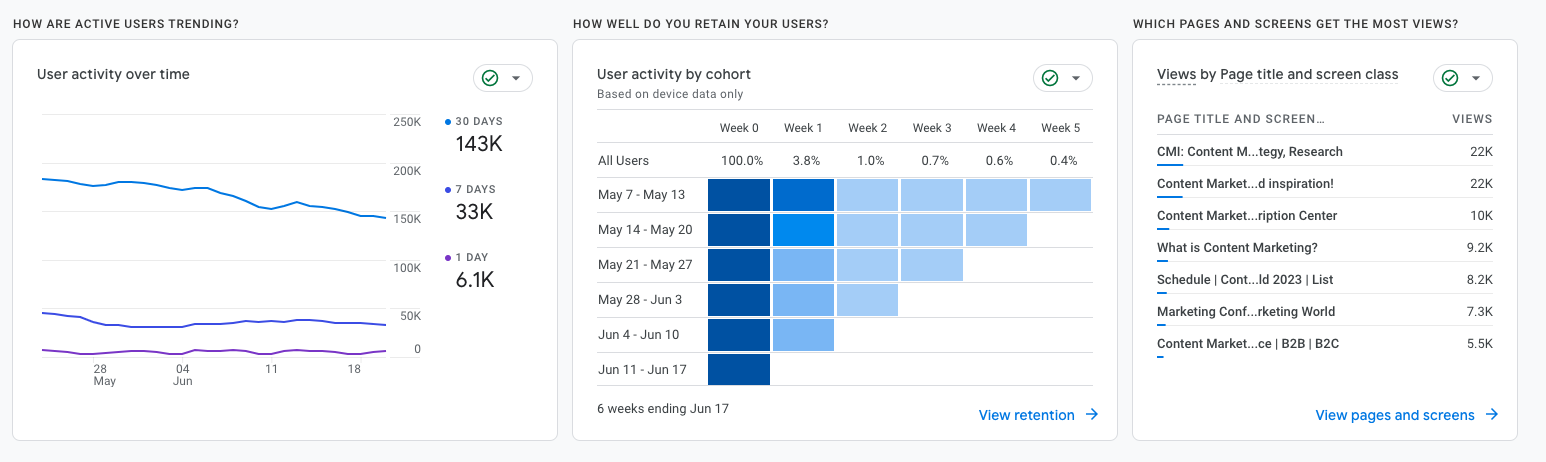
Click the links at the bottom of these cards to view more performance data related to that area of focus (e.g., retention or pages and screens, as shown above).
You can edit the conditions to filter the data displayed in the cards – for example, you can include/exclude certain demographics or time periods. You can also create up to five comparisons to add to this dashboard by selecting the Edit comparisons tool and selecting your preferred parameters.
The life cycle section
From the Reports page, use the side menu to navigate directly to additional dashboards. Under the Life cycle drop-down, select Acquisition or Engagement to access some of your familiar reports (like User acquisition and Traffic acquisition), as well as a few that are new to GA4 (like Events and Conversions).
You’ll also see two additional sub-sections in the side menu:
- Monetization is a collection of performance insights related to the in-app purchases, paid ads, and promotional campaigns you set up.
- Retention shows KPIs for that goal, such as average engage time of retained users and customer lifetime value.
Two new categories
Explore and Advertising are new categories built specifically for GA4. Explore gives you access to a library of existing report templates. You can also use the tools here to build custom reports. Click Advertising to view default dashboards for campaign performance, attribution models, and conversion paths.
New metrics and definitions in GA4
How GA4 defines and calculates its metrics isn’t always parallel with the UA experience. To adapt, your team will need to learn some new definitions. They may also need to view the resulting data through a different lens. Here’s a quick summary of the most important changes.
Interactions = Events
GA4 considers every interaction on your website or app an event, including visits, clicks on a link, PDF downloads, video views, and purchases.
User metrics redefined
UA had two user metrics – Total users (the primary metric) and New Users. But because GA4 collects data from app screens as well as site pages, Total users now means “total number of users who logged an event.” The new primary metric Active users refers to those who have satisfied Google’s conditions for an Engaged session (you can find a detailed explanation of those conditions here).
Easier conversion tracking
Measuring conversions in UA meant choosing a trigger action (such as completing a landing page form or clicking an ad) and configuring it as a goal – every time you launched a new campaign, landing page, or conversion event.
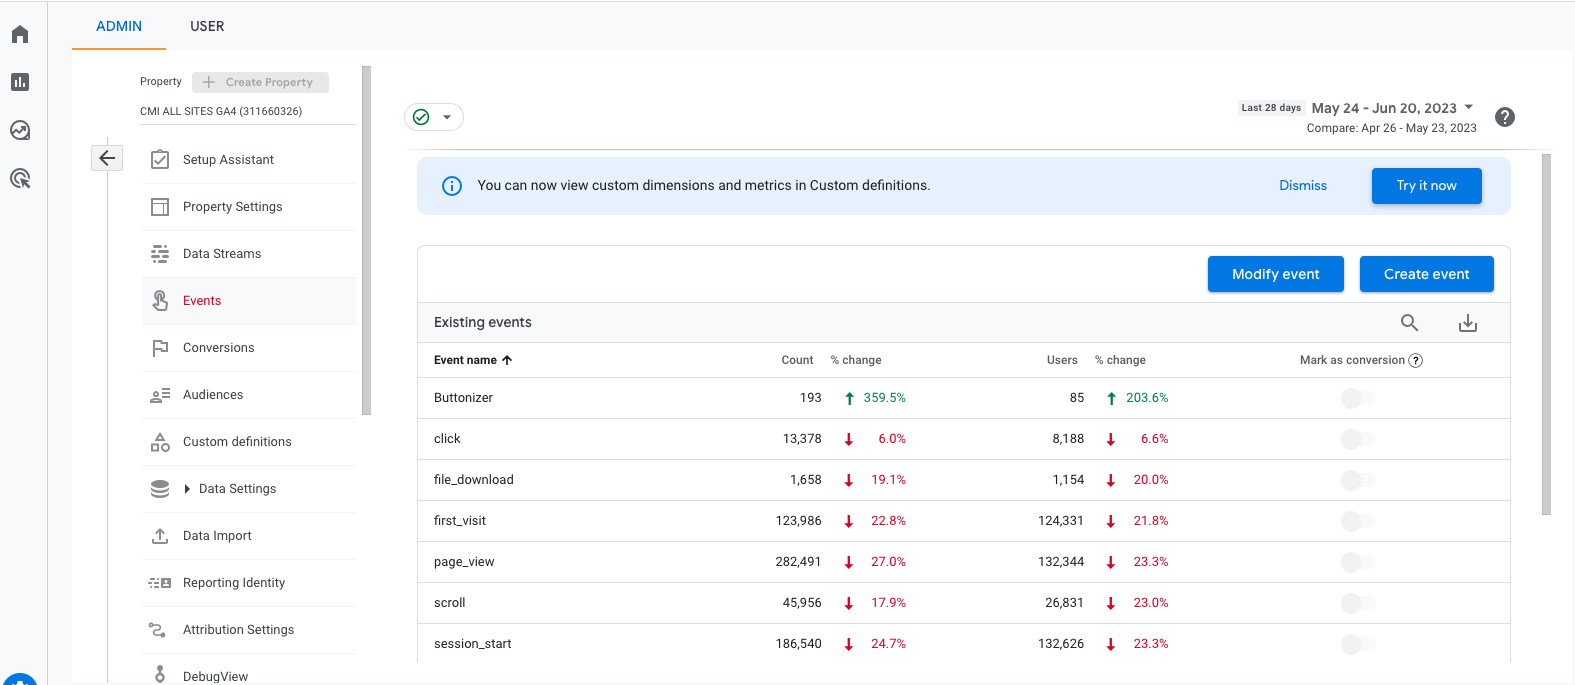
GA4 tracks all interactions as events, so you can designate any triggered event as a conversion goal just by toggling a radio button. Do this by opening your admin settings, selecting Events under the Property list, and clicking the button next to your chosen event to mark it as a conversion.
Sessions changes
As Google has also explained, all sessions reset at midnight in UA. And if a user left your site but immediately returned from a different referral source, marketing medium, or campaign ID (e.g., a promotion that uses a unique UTM code), UA considered it a new session, regardless of activity. That’s not the case in GA4, which means you might notice lower session counts in the new property.
There are distinct parameters for Engaged sessions –a metric that’s new to GA4. They’re sessions that last 10 seconds or longer, have one or more conversion events, or have two or more page or screen views.
New Bounce rate criteria
UA defined Bounce rate as the percentage of all sessions in which users viewed only one page and triggered only one request to the Analytics server. In GA4, it’s the percentage of sessions that were not Engaged sessions. So, if a user doesn’t meet any of the criteria of an Engaged session, it’s automatically counted as a bounce.
Pages drop out of Views
Because GA4 collects actions on app screens in addition to site pages, Page views got renamed as Views. This metric counts repeated views of a single screen or page (vs. UA, which didn’t count screens).
Find more answers
The details above only scratch the surface of GA4’s revised features and fundamental terms.
Here are some additional resources to explore to learn more about the differences between UA and GA4 – and how those differences might affect the meaning of your metrics data.
